Gantt chart
Graphical representation of data greatly facilitates the possibility of their perception and analysis. It is for this purpose that a tab "Gant" is added to the window of each project, where it is possible to plan projects using the Gantt chart. A Gantt chart is a popular type of bar chart used to illustrate a plan or work schedule for a project by displaying tasks in the form of segments on a timeline. 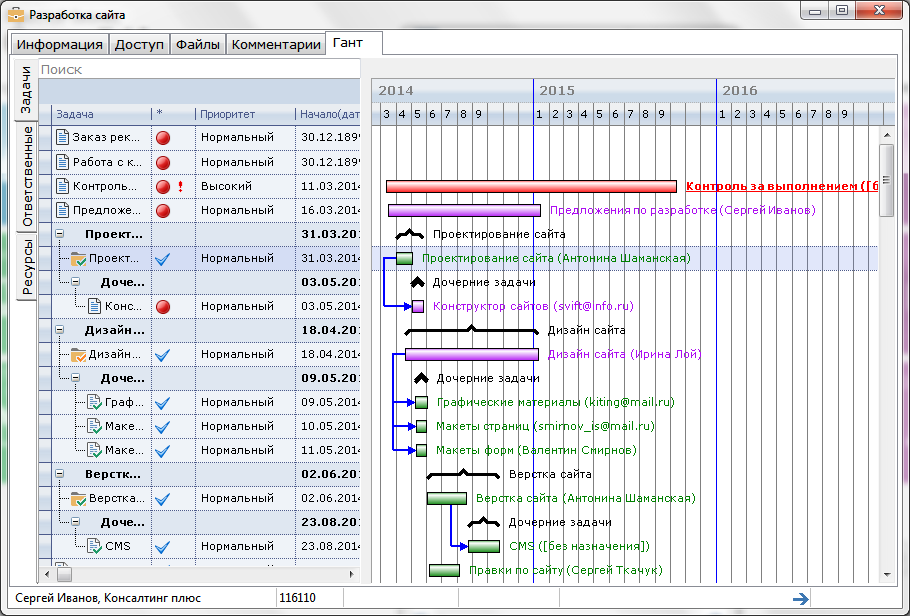 In the left part of the "Gant" window there are three tabs "Tasks", "Responsible" and "Resources", with which you can get various options for plotting the diagram in terms of tasks, resources and personnel responsible for the execution of projects. The window of the "Tasks" tab consists of two parts: in the left part of the window there is a list of tasks entering the project, designed in the form of a table. For each task in the table, the name, priority, time interval and performance mark are indicated. The right part of the window is occupied by a diagram showing the relationship between the execution of tasks and the timeline. The following conventions are used in the diagram: the green color of the segment indicates the task completed, the red segment is a task of increased importance. Lilac color marks tasks that are not met on time. Arrows schematically show the structure of subordination of tasks to each other. If it is necessary to obtain information about the tasks performed in the context of the responsible persons, you must select the "Responsible" tab for consideration. In the left part of the window, a table will be presented listing the employees of the organization and the tasks assigned to each for execution on the specified dates. In the right part of the window, a graphical representation of each task is provided. The "Resources" tab is reserved for presenting information on the total costs for the execution of the project, including decoding for each individual task. In the lower part of the window, the total cost of the project is reflected, and on the diagram in the conventional symbols, you can visually see the cost of each resource - payment for work and services, cost of consumables, etc. Thanks to the visual presentation of data on the Gantt chart, the user can easily assess the sequence and duration of tasks, the length of the project as a whole, compare and analyze in detail the planned and real process of performing tasks.
|